Receive
Measure inbound batch size, decant labor and replenishment windows before setting port demand.

Map receiving, replenishment, storage, picking and exception recovery before sizing robots, ports or grid capacity. Our friendly engineering path keeps operating assumptions visible from the first workshop through SAT.
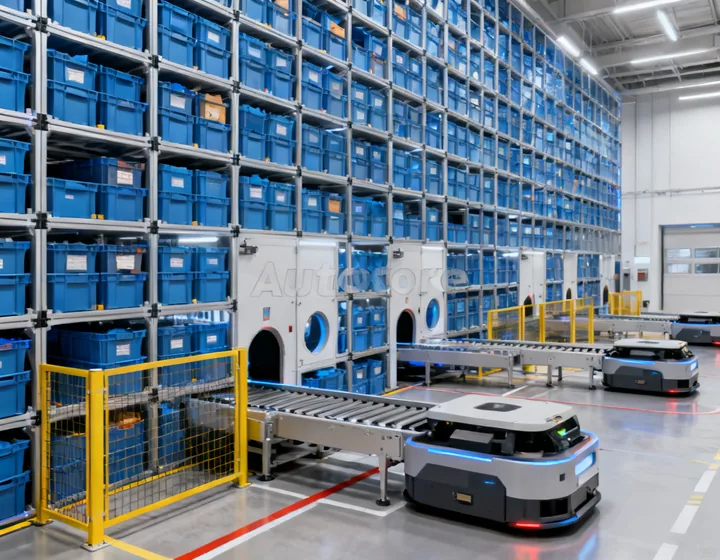
Six practical stages keep equipment choices tied to inventory and order behavior.
Measure inbound batch size, decant labor and replenishment windows before setting port demand.
Balance cube utilization with bin presentation frequency, maintenance access and expansion geometry.
Model robot travel, charging, congestion and degraded-mode routing across the grid.
Match port ergonomics and presentation logic to order lines per hour and operator work content.
Protect waves and cutoffs with explicit queue limits, replenishment priorities and exception states.
Connect completed work to packing, sortation and dispatch without hiding downstream constraints.
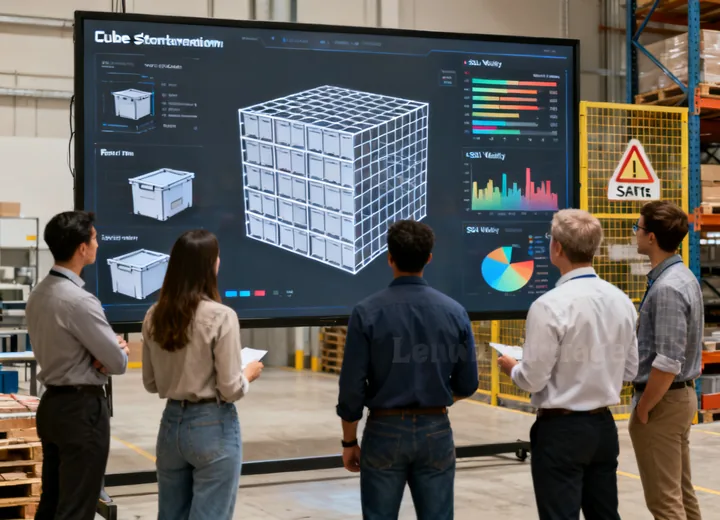
A headline pick rate is meaningful only with the SKU mix, order profile, peak duration, buffer occupancy and recovery method stated beside it. AutoStore workshops preserve that chain of evidence. Design order lines per hour, tote or bin locations, rated load in kg and interface cycle time in seconds are recorded with their source distributions rather than as stand-alone marketing numbers.
Simulation and digital-twin runs help compare concepts, but they inherit the quality of SKU velocity inputs, congestion assumptions and control timeouts. Emulation can exercise WCS and PLC handshakes before site work; it still cannot replace FAT fault sequences or SAT with representative loads. Functional safety targets such as performance level (PL) remain project-specific and require competent risk assessment for the chosen guarding, access and intervention method.
High SKU depth and volatile peaks reward flexible port allocation, but replenishment and exception queues must be modeled.
Review the profile →Store waves, case breaks and cutoff discipline need a flow concept that covers both predictable runs and late changes.
Review the profile →Deep assortments and service-level priorities make bin strategy, inventory accuracy and recovery access central.
Review the profile →Start with load units, SKU velocity, order lines, peaks, interfaces and building constraints. We will help separate design inputs from assumptions that still need evidence.